Bar Count Indicator: 5-Minute Price Action Practice
Use ChartMini's Bar Count indicator in five-minute replay. Learn candle numbering, display settings and a bar-by-bar price action practice exercise.
The Bar Count indicator puts numbers beneath candles so you can refer to a specific bar while studying price action. In ChartMini's day trading simulator, you can add it to historical five-minute crypto or forex replay and reveal the next candle with Next Bar.
That gives a practice note a clear reference: “The pullback began at bar 198; what had changed by bar 202?” You can record what you saw before advancing, then compare your expectation with the next revealed bars. Numbering makes observations easier to review; it does not identify a trading setup for you.
This tutorial covers ChartMini's actual indicator controls and a numbered-bar exercise. For a complete session routine, use the separate day trading practice guide.
What Bar Count shows on the chart
Bar Count is a candle-numbering aid. With the default display interval of 2, labels appear at 2, 4, 6 and subsequent even numbers. The unlabeled candles still count. Changing the interval to 1 displays every bar number; it does not change the replay speed or candle duration.
The screenshot below shows an ETHUSDT five-minute replay, amber labels below candles, and the indicator legend Bar Count 2 25 Normal. Those values describe the display interval, label distance and label size.
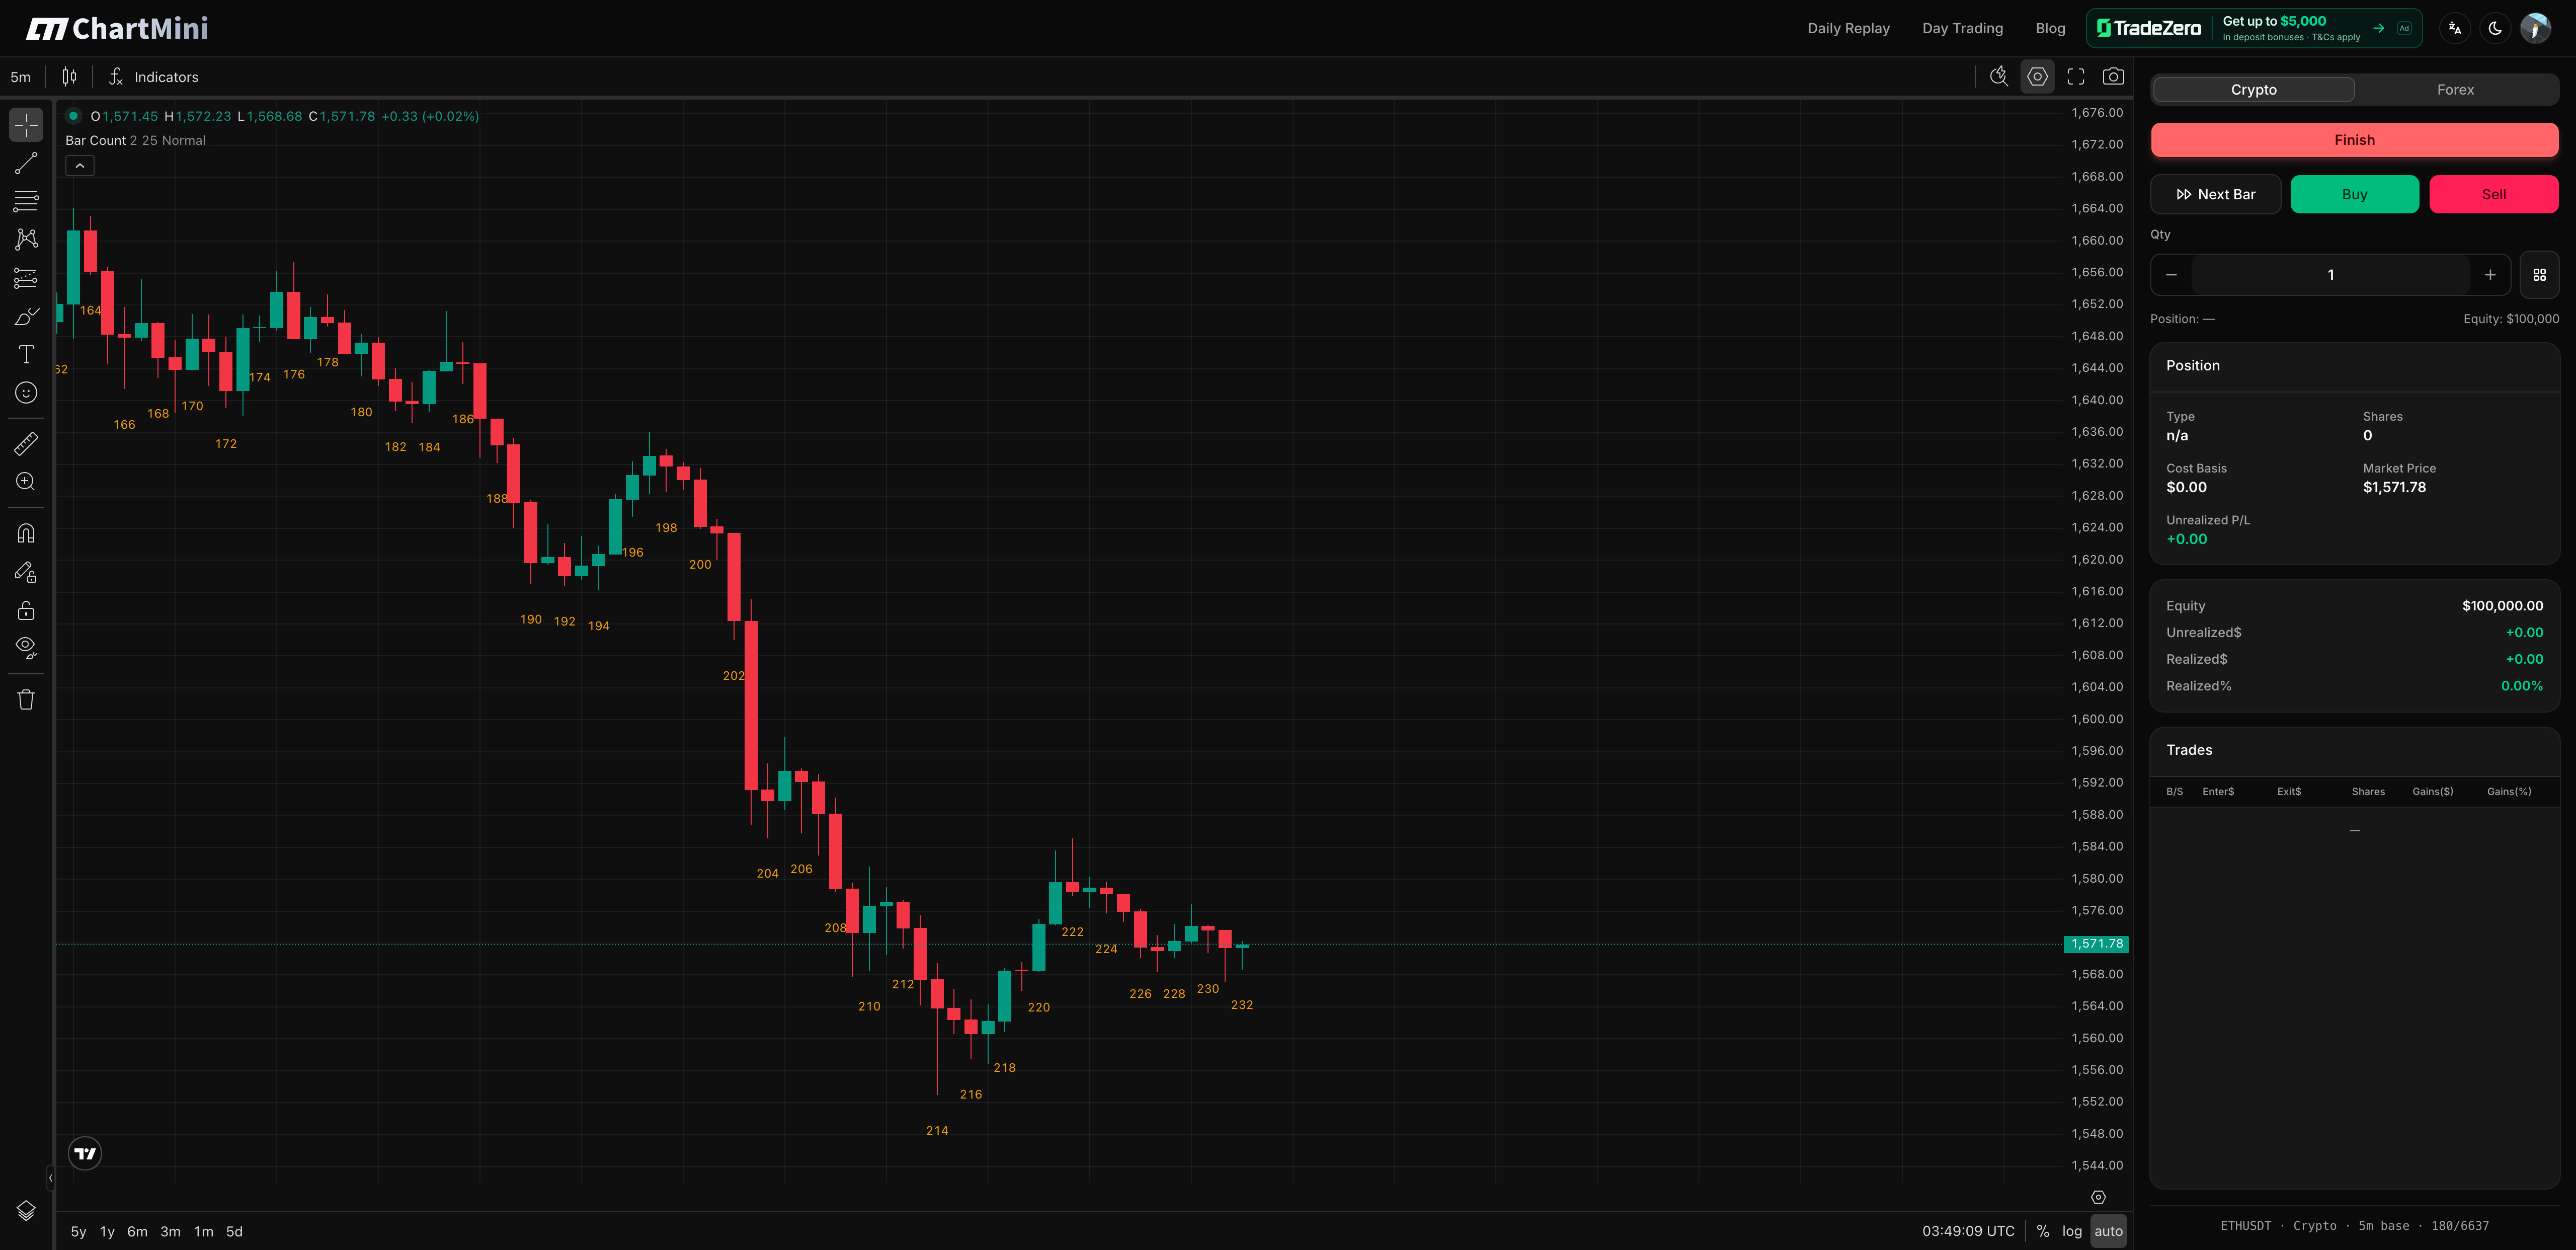
Labels can help you compare the length of a pullback, locate a breakout attempt, or find the same candle in your practice notes. Price structure still comes from the candle highs, lows, bodies, overlap and surrounding context.
How to add Bar Count in ChartMini
- Open the five-minute day trading simulator. Choose Crypto or Forex before starting your replay.
- Click Start and wait for the historical chart to load. Use the default 5m chart for this exercise.
- Open Indicators in the chart toolbar. Its menu is labeled Indicators & Strategies.
- Search for Bar Count, select the indicator, and close the indicator menu. The name and number labels should appear on the chart.
- Open the indicator's Settings, or double-click its Bar Count legend, to change the inputs. Start with every second bar for a cleaner chart, or every bar for a close reading exercise.
- Write your observation before clicking Next Bar. Each replay step reveals another five-minute base candle; keep the displayed interval at 5m to review those steps individually.
ChartMini lets you start without signing up and uses simulated money. The starting market and history are selected by the replay mode; this workflow does not provide an exact symbol, historical date or session picker.
Bar Count display settings
The indicator's Inputs include:
- Display at every X bars: default 2; supported values 1–50. A larger interval reduces label clutter while all candles remain part of the count.
- Distance from candle (px): default 25; supported values 4–40. Increase it if labels sit too close to candle lows.
- Label Size: default Normal, with Auto, Huge, Large, Small and Tiny alternatives.
- Text Color: choose a color that remains readable against your chart background. The default is amber.
When numbers overlap, zoom in or display fewer labels. These settings change readability rather than the underlying price action. A chart showing every second number still contains the candles between those labels. ChartMini displays up to 500 number labels, so older candles can remain unlabeled when you zoom out. Focus this exercise on the recent revealed sequence.
Understand the UTC reset before using a bar number
ChartMini counts bars within each UTC calendar date, starting with the first available bar for that date in the loaded history. It restarts when the UTC date changes. It does not reset specifically at the New York stock-market open or recognize an exchange's regular trading session.
Two practical consequences matter:
- A number such as 78 is not automatically “the 78th bar since the U.S. market opened.” The replay market, available history and UTC boundary determine the reference.
- Loading earlier history can change numbers on the earliest partially loaded date. Record the market, displayed interval and chart context with your notes; a bar number alone is not a permanent timestamp.
Keep the same interval while comparing notes. Aggregating candles into a larger displayed interval changes what constitutes a chart bar. If you need a count from a particular session open or swing point, identify that starting candle yourself and keep a separate relative count.
For example, on an uninterrupted five-minute sequence within the same counting period, moving from bar 208 to bar 214 is six bar steps, representing 30 minutes. It is not three steps because only even numbers are displayed. Missing data or a reset can break the simple time conversion, so check the sequence before using it.
Bar numbers versus H1/H2 and L1/L2 price action counting
The phrase “bar counting” can refer to different tasks. Sequential labels tell you which candle you are discussing. H1/H2 and L1/L2 terminology describes successive price-action attempts within a pullback or range context.
The Brooks Trading Course glossary defines high and low counts through relationships between successive bar highs or lows and the surrounding formation. These are pattern descriptions, not the ordinal number printed below a candle.
An H2 can occur at chart bar 214. The printed 214 does not make the candle an H2; you must assess the preceding price action. ChartMini's Bar Count does not automatically label H1, H2, L1 or L2, count pullback legs, or generate entry signals.
This distinction makes the tool useful for learning those methods: you can write “possible second attempt at bar 214” and later review the actual surrounding candles. If your reference material uses session-open numbering, confirm its reset convention before comparing it with ChartMini's UTC-based labels.
A bar-by-bar price action practice exercise
Use the counter to make your observations reviewable. You can complete this drill without pressing Buy or Sell.
1. Choose one question before revealing more bars
At the current revealed candle, describe the visible environment: rising swings, falling swings, or overlapping range bars. Identify the exact price level relevant to your question.
An example question is: “Will the next three revealed candles extend beyond the recent swing high, or remain inside the pullback?” This is a hypothetical observation task, not a prescribed entry rule or a prediction that the breakout will work.
Record the current bar number and freeze the three-bar review horizon. If you change the question after seeing the outcome, keep the original note and record the change separately.
2. Record each revealed candle
For a fictional starting reference of bar 208, your record could be:
- 208 — before advancing: context, recent swing high or low, the level under observation, and what would invalidate your interpretation.
- 209 — after one Next Bar: whether the candle crossed that level, where it closed, and how much it overlapped the prior bar.
- 210 — after the second step: whether the move extended, stalled or returned inside the previous range.
- 211 — end of the preset horizon: what happened, what remains ambiguous, and whether your original description still fits.
With every-second-bar labels, 209 and 211 may not have printed labels. Set the display interval to 1 for this drill, or count the intervening candles manually. Do not skip an observation simply because its label is hidden.
3. Review the observation before reviewing simulated P&L
Ask whether you described the available context accurately, recorded a falsifiable expectation, and kept the review horizon unchanged. A move in the expected direction does not by itself validate an entry, stop or complete strategy.
If you also place a simulated trade, keep its entry, exit and result in a separate section. That prevents a profitable historical outcome from rewriting what you actually knew at the decision candle. A completed-chart screenshot is useful for review after the exercise; looking at future candles before recording the decision introduces hindsight.
What this five-minute replay can and cannot practice
ChartMini's intraday workspace supports crypto and forex historical charts. It can help you rehearse candle reading, compare successive bars, and document decisions with future candles hidden until you advance.
The separate stock Daily Replay uses daily candles. This tutorial does not describe five-minute stock or futures replay. The Bar Count numbers also do not reconstruct ticks inside an OHLC candle, reveal the order in which its high and low occurred, or reproduce a broker's spread, slippage, queue priority, margin and order handling.
Use the numbered-bar drill for visual interpretation and a consistent review record. For the wider framework behind those observations, read the price action guide. For broker-specific order practice, use an appropriate broker demo rather than treating candle replay as an execution test.
Frequently asked questions
Is Bar Count a buy or sell indicator?
No. It displays candle numbers. Direction, setup quality and any trading decision require separate analysis of the price action and risk context.
Why do the labels show 2, 4, 6 instead of every number?
The default display interval is 2. All candles are counted, but only every second number is printed. Set Display at every X bars to 1 to show every label.
Can I use it to study Al Brooks-style price action?
You can use the numbers as references while manually studying pullbacks and successive attempts. ChartMini does not automatically classify Brooks setups, and its UTC reset differs from a counter configured for a specific market session.
Do I need a TradingView subscription to add it in ChartMini?
No separate TradingView subscription is needed for this ChartMini workflow. Open the simulator, start a replay, and add Bar Count through its chart's Indicators menu.
Start five-minute replay practice with Bar Count, or return to the ChartMini blog for the broader guides.

























